eReefs Research Project – New Marine Water Quality Dashboard released
 The Marine Water Quality Dashboard, a tool to access a range of water-quality indicators for the Great Barrier Reef is now available at http://www.bom.gov.au/marinewaterquality/.
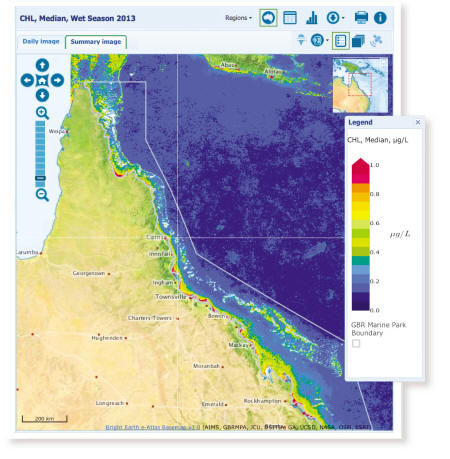
The Dashboard uses near real-time data, and more than ten years of records of sea surface temperatures, chlorophyll levels, suspended sediments, and dissolved organic matter to provide important information for decision-making.
Data from the Dashboard can be displayed in different formats (map, table or chart) and downloaded for further analysis and interpretation.
The Dashboard has been developed through collaboration between the Australian Institute of Marine Science, Bureau of Meteorology, CSIRO, Great Barrier Reef Marine Park Authority and the Queensland Government and is delivered as part of the eReefs project.
How does the Dashboard work?
The Bureau of Meteorology receives daily satellite information about the frequency of light which enables the water colour and the sea surface temperature to be determined for the Great Barrier Reef.
This information is enhanced by the Dashboard which uses sophisticated algorithms developed by CSIRO to filter out interference from the atmosphere. This interference appears in satellite images taken at such distance from the sea surface.
By comparing the colour of the water to meas¬urements of sediments, chlorophyll and dissolved organic matter, relationships are made between satellite imagery and the actual water in the reef.
Why is this important?
The temperature of the sea surface is an important environmental indicator. It can be used to assist decision-making where water temperature is a major factor influencing operations on or near the ocean’s surface, or where it can be used to infer properties of the ocean environment just below the surface.
A specific example is in helping to predict and respond to coral bleaching events.
Information about the amount of light in the water and the concentrations of chlorophyll and sediments are important for managing sea grass beds and the production of large algae that may compete with coral for space on the reef.
Anyone, including the general public, can now view and download data of daily or aggregated ocean colour data of the GBR region.
For further information please contact:
Visit http://www.bom.gov.au/environment/ or contact environment@bom.gov.au
Related links
- Brochure: How does satellite imaging of ocean colour help us monitor and improve the health of the Great Barrier Reef? [PDF, 7106KB]
- Media Release: Better water quality monitoring information for the Great Barrier Reef [external link]
- SIEF e-Reefs webpage – Transforming the Science and Management of the Great Barrier Reef